Program Description:
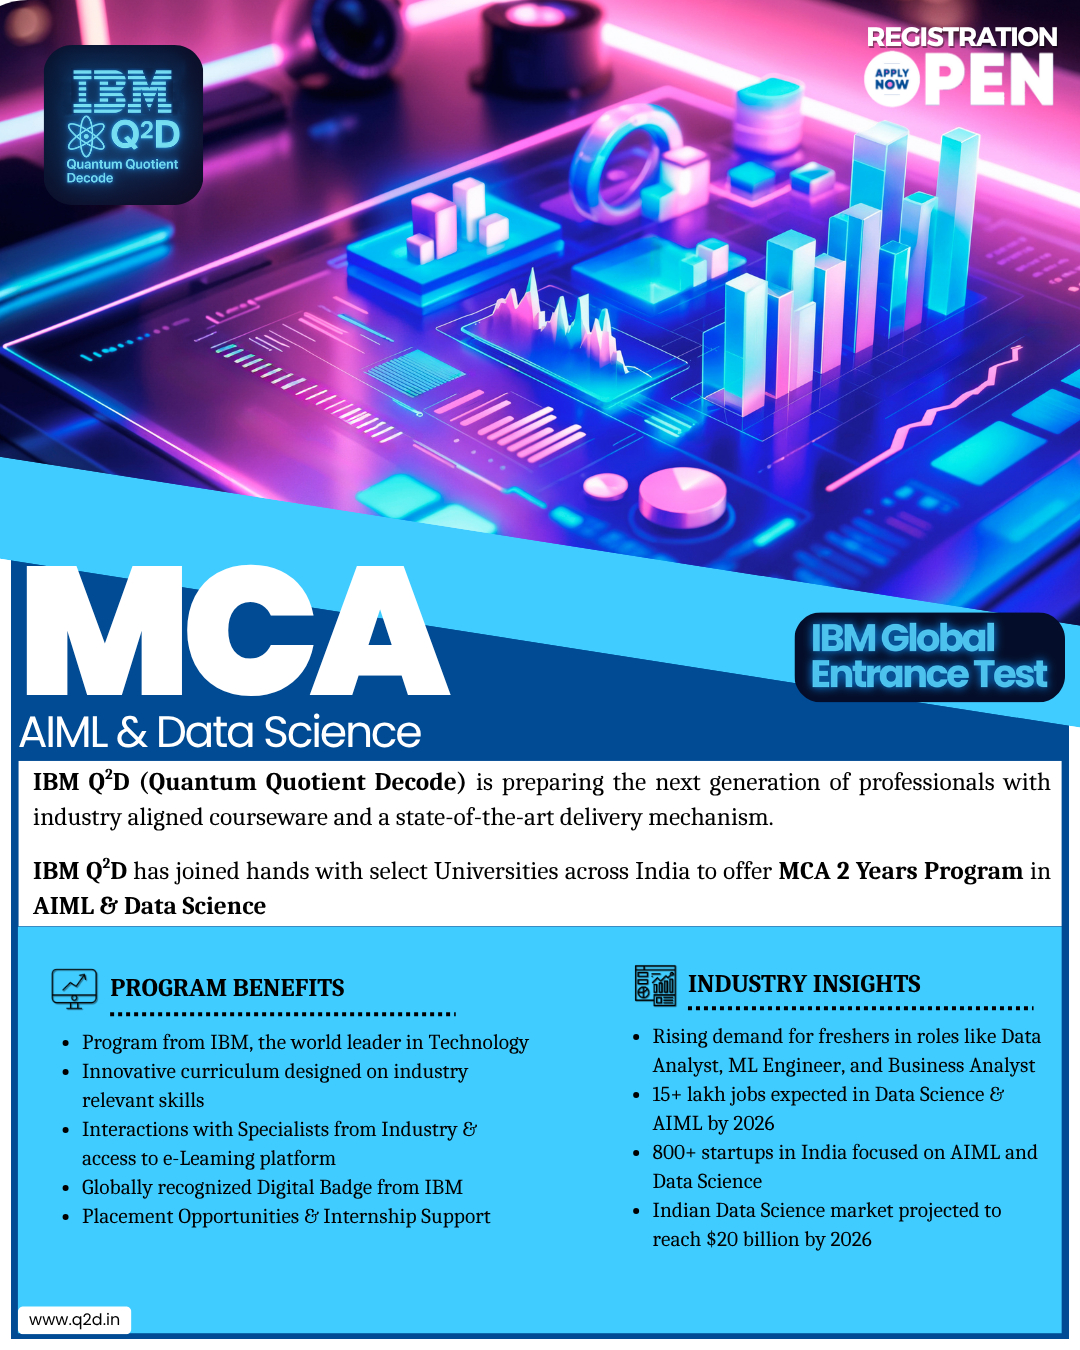
IBM Q²D is a global initiative offering specialized master’s programs in collaboration with top academic institutions. We are offering an advanced 2-year MCA program specializing in AIML & Data Science.
S - Vyasa Deemed to be University located inside Sattva Global City, Kengeri, which is a NAAC A+, Category 1 University, would be the first university in India to execute this model of student engagement in partnership with IBM. The program is designed to equip students with cutting-edge skills, real-time exposure, and practical project experience, aligning with future workforce demands.
You've embarked on a cutting-edge master's program, crafted with industry leaders and delivered by IBM subject matter experts in a world-class learning environment.
Program benefits include:
- A Postgraduate Degree awarded by S-VYASA
- An Advanced Certificate Digital Badge from IBM
- Advanced Learning Certificate from Cambridge University Press and Assessment
This strategic academic-industry collaboration is designed to equip students with both foundational knowledge and practical skills in emerging domains, preparing them for high-impact careers in the digital era.
Campus Location:
All programs are conducted at the futuristic S-VYASA Bangalore Campus, located inside Sattva Global City IT Park, Kengeri.
The "IBM ICE Advanced Certificate - Data Analytics" program is a comprehensive program designed to equip learners with the essential skills and knowledge to analyze data, derive insights,and support data-driven decision-making across various industries. Spanning approximately 200+ hours, this program covers foundational Python programming for data analysis, descriptive analytics and business intelligence, predictive and advanced analytical techniques, big data analytics, and the practical application of these skills in key business domains.


FEE STRUCTURE 2025-26
| Duration: 2 Years | I YEAR | II YEAR |
| Admission fee | 15000 | - |
| Tuition Fee | 295000 | 280000 |
| Other Academic Fee | 5200 | 5200 |
| Total Fee | 315200 | 285200 |
Program Objectives
Upon successful completion of this program, learners will be able to:
- Master the fundamentals of the Python programming language and its essential libraries (NumPy, Pandas) for data analysis.
- Apply descriptive statistics and data aggregation techniques to summarize and understand historical data.
- Build interactive Business Intelligence (BI) dashboards using Excel.
- Understand the core concepts of predictive analytics and various modeling approaches (regression, classification, clustering, time series).
- Implement predictive and advanced analytical models using Python libraries like Scikit-learn.
- Grasp the concepts and technologies for handling large datasets within the Big Data landscape.
- Understand the fundamentals of distributed data processing using tools like Apache Spark and the Hadoop ecosystem.
- Apply data analytics techniques to solve specific problems and drive decision-making in industries such as Banking, Retail, Healthcare, Manufacturing, Finance, HR, Marketing, and Supply Chain.
- Analyze real-world case studies of data analytics applications in various business domains.
Program Summary
This program is structured into five progressive modules that cover the entire data analytics lifecycle. Module 1 establishes a strong Python programming foundation for data manipulation and analysis. Module 2 focuses on summarizing and visualizing data using descriptive analytics and BI tools. Module 3 introduces predictive and advanced analytical techniques and their implementation in Python. Module 4 delves into the world of Big Data and distributed data processing. Finally, Module 5 provides practical application of the learned analytics skills within various industry contexts.
Flow of Learning Modules:
- Core Python syntax, data types, control flow, functions.
- Essential data structures: Lists, dictionaries, tuples, sets.
- Introduction to NumPy for numerical operations and array manipulation.
- Introduction to Pandas for data manipulation and analysis using DataFrames.
- Basic data handling: Reading and writing data from various file formats.
- Descriptive statistics: Measures of central tendency, dispersion, and distribution.
- Data aggregation and summarization techniques.
- Data visualization principles and techniques in Excel.
- Building interactive dashboards in Excel for business intelligence.
- Understanding key performance indicators (KPIs) and their visualization.
- Basic data storytelling using visualizations.
- Core concepts of predictive analytics and model building.
- Regression analysis: Linear regression, polynomial regression.
- Classification techniques: Logistic regression, decision trees, random forests, support vector machines.
- Clustering algorithms: K-Means, hierarchical clustering.
- Time series analysis: Basic concepts and forecasting methods.
- Model evaluation and selection using Python's Scikit-learn library.
- Introduction to model deployment concepts.
- Introduction to the Big Data landscape: Volume, velocity, variety, veracity.
- Understanding the Hadoop ecosystem: HDFS, MapReduce (conceptual).
- Fundamentals of distributed data processing using Apache Spark.
- Spark architecture and core concepts (RDDs, DataFrames).
- Basic data manipulation and analysis using PySpark.
- Introduction to NoSQL databases (conceptual).
Program Outcomes:
Upon successful completion of this program, learners will be able to:
- Write and execute Python code for data analysis tasks using NumPy and Pandas.
- Apply descriptive statistics and build BI dashboards in Excel to summarize data.
- Implement and evaluate predictive models using Python's Scikit-learn library.
- Understand the concepts and tools for working with Big Data, including Apache Spark.
- Apply data analytics techniques to solve real-world problems in various industries.
- Analyze case studies of successful data analytics implementations.
- Communicate data-driven insights effectively.
Skills Gained:
Upon completion of this program, learners will gain the following skills:
- Python Programming for Data Analysis: Proficient in using NumPy and Pandas.
- Descriptive Analytics: Summarizing and understanding data using statistical methods.
- Business Intelligence: Creating dashboards and visualizing data in Excel.
- Predictive Modeling: Implementing regression, classification, clustering, and time series models using Python.
- Big Data Analytics: Understanding the fundamentals of Hadoop and Spark.
- Data Visualization: Creating effective charts and graphs to communicate insights.
- Problem Solving: Applying data analytics techniques to solve business challenges.
- Critical Thinking: Analyzing data and drawing meaningful conclusions.
- Industry Awareness: Understanding the application of data analytics in various sectors.
